To manage your online store effectively, you need to know what’s going on in it. You need to get reports and see the stats for your store. Specifically, you need to understand where your customers come from, how much money they spend, what products are selling best, how well your special offers perform and more.
Online store can provide you with these data in a convenient dashboard. Go to your Control Panel → My Sales → Reports page to see the available tools and set up reporting.
Basic reports and sales stats
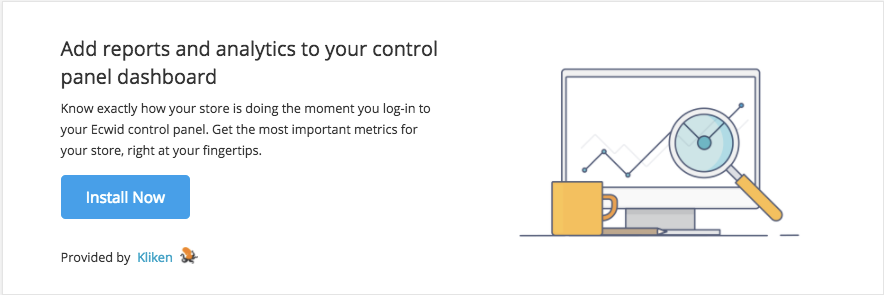
You can get the most important metrics for your stores like the number of visitors and orders, revenue and conversion rates in your Control Panel → My Sales → Reports page.
On the top of this page, click "Install Now".
After you install the app, click "Open", and you’ll see a pop-up with the basic metrics.
You can display the stats for the day, month, or any custom period and check the detailed information for each metric.
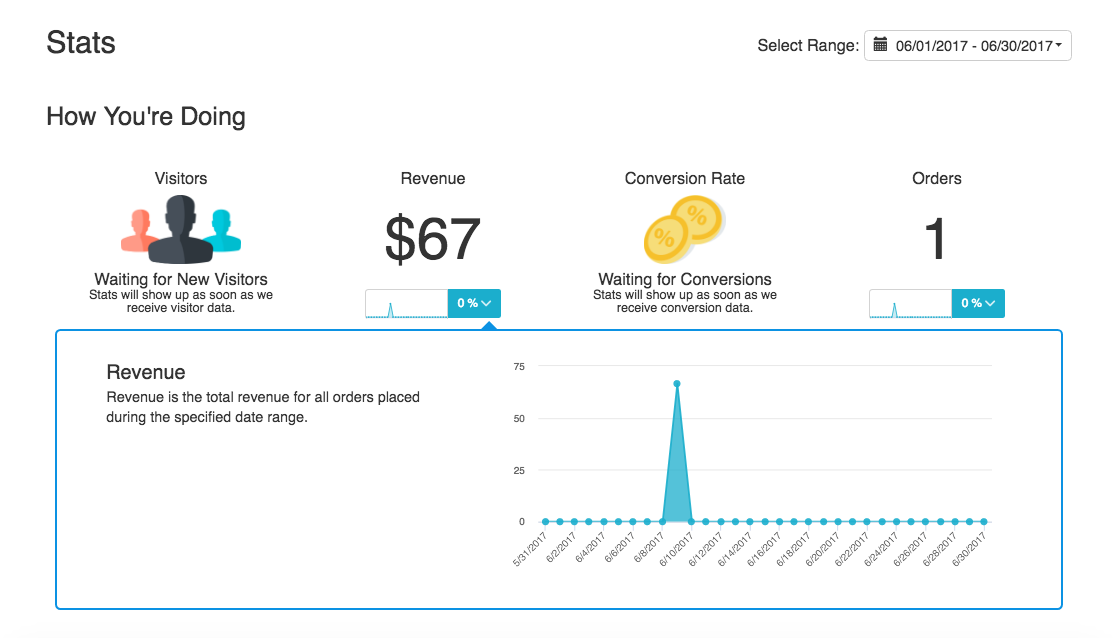
Under the extended stats, you can check the items and revenue per order, the number of visits until purchase and the time spent to purchase, the top-selling products and categories, the sources of traffic and more.
Real-time sales tracking
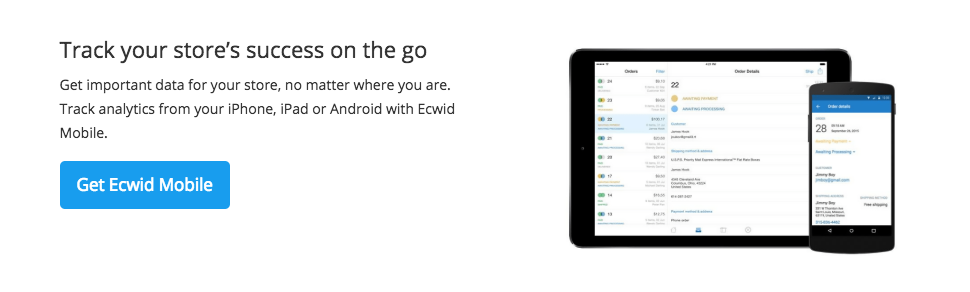
If you want to know about each order that is placed in your online store, you can track the sales with our mobile app and receive a push notification on your iPhone, iPad, or Android device any time an order is placed or a payment has been accepted.
To install the app, go to your Control Panel→ My Sales → Reports page and follow the setup steps or download it on the App Store or Google Play.
If you are already using the app, you simply won’t see this block on your reports dashboard.
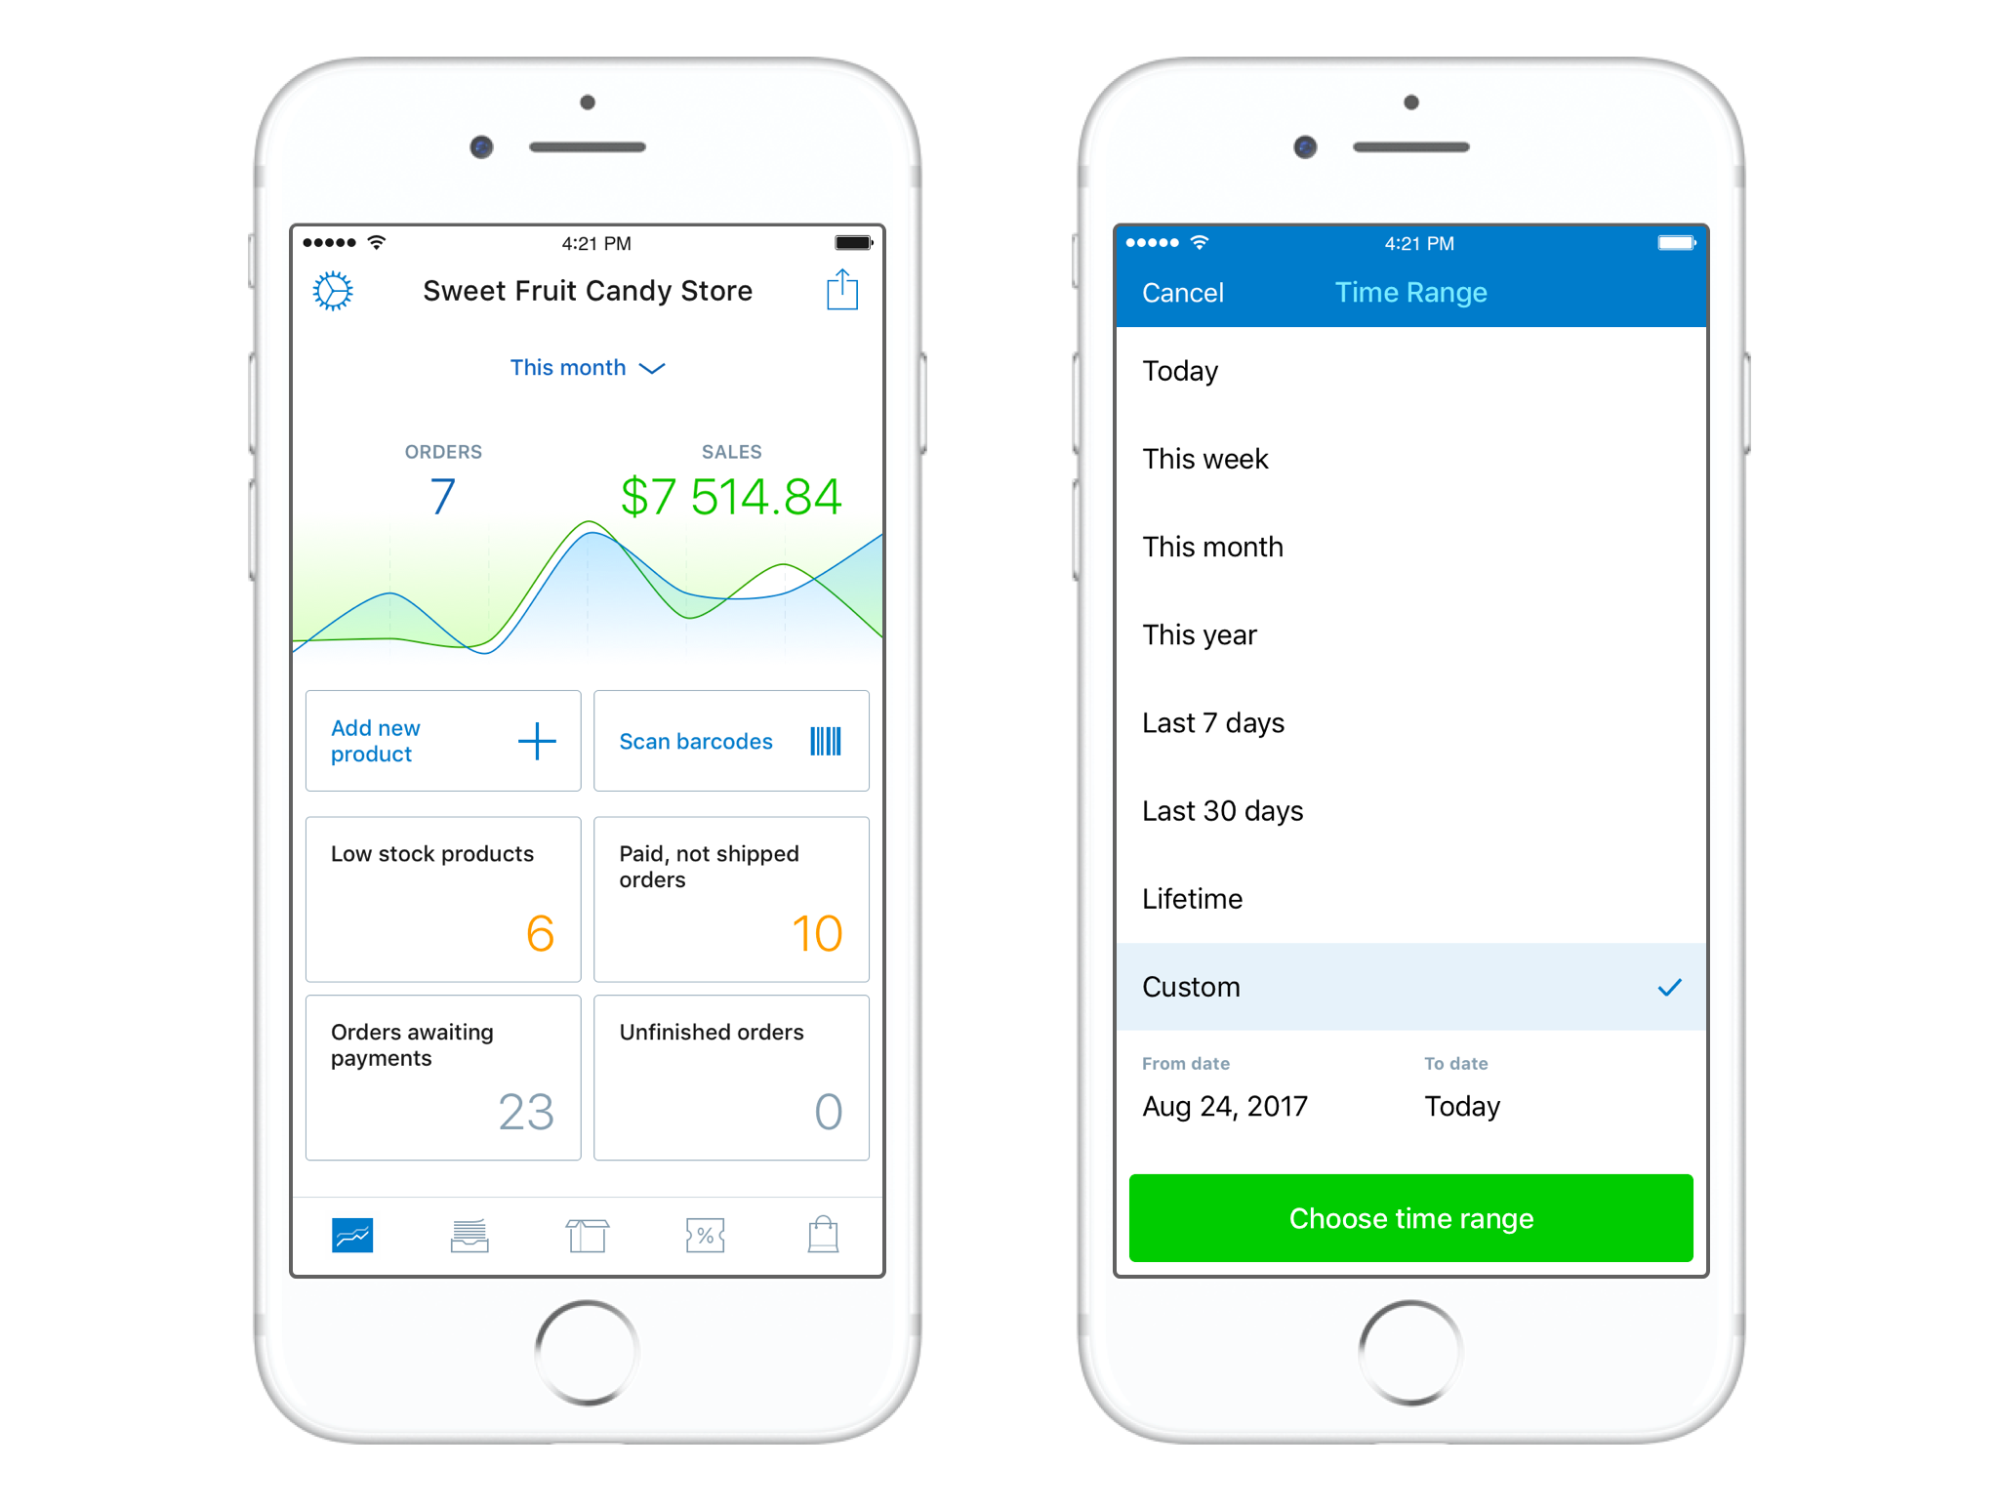
Besides the sales tracking, the mobile app allows you to manage orders, add new products and modify existing inventory and even accept payments (coming soon for Android).
It’s basically all you need to manage your business when you are constantly on the move.
Advanced reports and sales analytics
Google Analytics
If you want to get more advanced statistics, better understand the visitor behavior, analyze traffic sources and optimize your store for sales, you can connect your online store with Google Analytics.
With the help of Google Analytics you will be able to track:
- Sales Funnels — and find out what steps your customers go through before they buy or don’t buy and understand whether the checkout process in your store is effective.
- Visitor Engagement — and see how much time a visitor spends in your store and what pages they open.
- Historical Benchmarking — and check how your acquisition channels performed this year versus last year.
To get started, create a Google Analytics account, if don't have one, and connect it to your store:
- Click "Set Up Google Analytics" in your Control Panel→ My Sales → Reports.
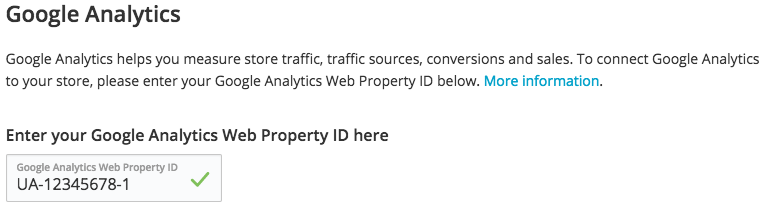
- Enter your Google Analytics Web Property ID (How to get your ID).
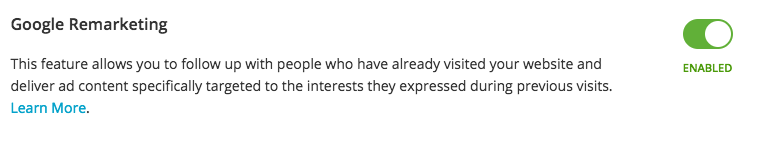
If you are going to run paid search ads with Google Adwords, enable the Remarketing feature to advertise to your store visitors and return those who left without a purchase or remind your existing customers about your store.
The stats will show up during the next 24 hours. You can check them in your Google Analytics dashboard.
Facebook Pixel tracking
The Facebook Pixel is a piece of code from Facebook that you can add to your website or online store and use to retarget, optimize, and track the effectiveness of your Facebook advertising campaigns.
To get started, create a Facebook Pixel and add your Facebook Pixel ID at Settings → General → Tracking and Analytics in your Control Panel.
Next verify that your Pixel is working and once it’s active proceed to creating Facebook Ads. After creating the ad, you will be able to check its performance and measure the conversions in your Ad Manager.
Multichannel analytics
With the help of the Monkey Data app you will get the stats from the multiple channels, like AdWords, eBay, Facebook, Google Analytics, email, and others, plus your store stats.
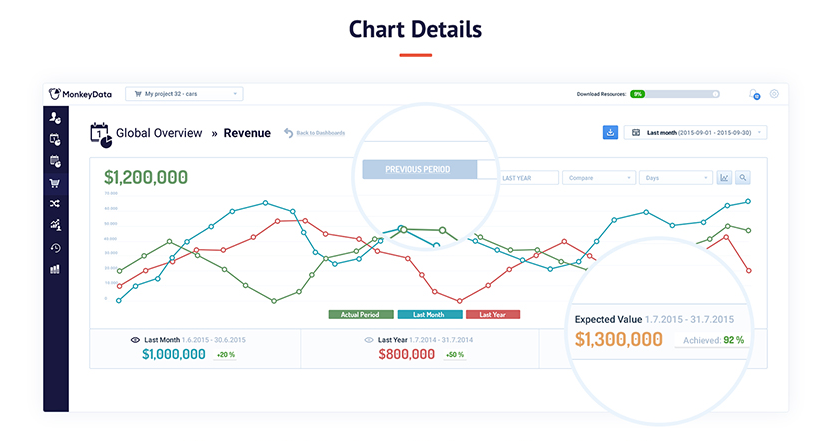
As a result, you’ll see a detailed, intuitive picture of how your sales channels perform. You’ll also be able to compare the data for different time ranges.
More apps like Monkey Data: Convead
Visitor actions recordings and heat maps
Lucky Orange app can track anonymous sessions of your actual customers so that you see how they browse, what they click on, and where they leave.
You can also examine your store on the heat maps, which collects customer actions (clicks) and shows you where they click the most.
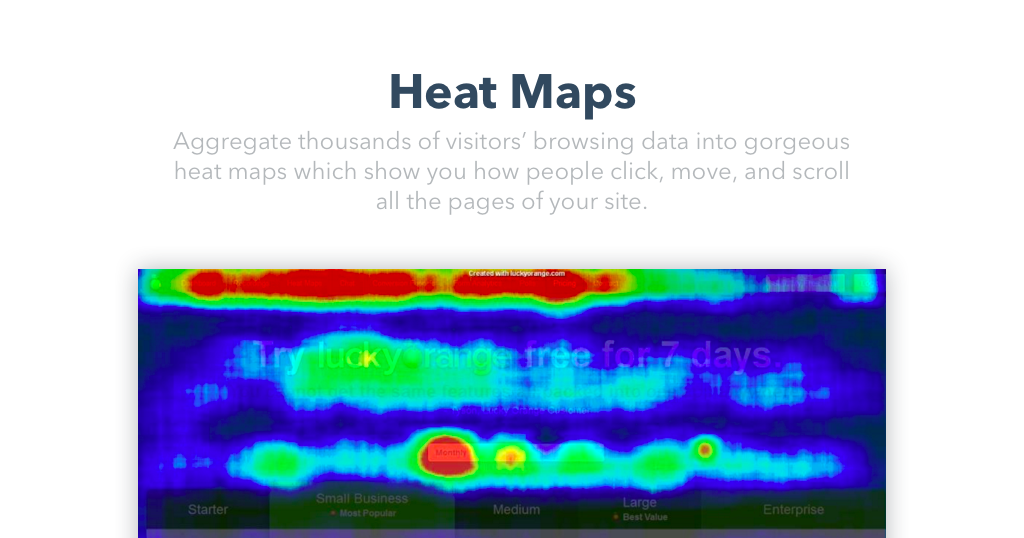
Heatmaps allow you to understand if your website design is convenient and attractive and to adjust some things based on the customer behavior.